
Utilizing comparisons with previous cycles can help us better understand the current exchange supply situation.
Is there a bitcoin supply shortage on exchanges?
Yes and no.
The bitcoin balance on exchanges has received a lot of attention during this bull run because the change in these balances sticks out. In previous bull runs, what can be observed is that, often, with bitcoin’s price increasing, the bitcoin balance on exchanges has increased. This can be seen in Figure 1 where Glassnode has compiled the addresses of spot exchanges holding bitcoin and aggregated them.
Even with bitcoin’s price going sideways or down, historically, the trend has been upward. This trend has reversed during this bull run, and since March 2020, the bitcoin balance on exchanges has been in a declining trend. This trend has been going on for over a year now. Compared to that in, or right before, the last bull run, the fall in exchange balance from July to December 2016 lasted only six months, before taking off in 2017 with bitcoin’s price taking off as well. If the underlying dynamics have not changed, and the exchange balance drop in 2016 and what followed in 2017 is an indication, the prolonged decline in exchange balances this time might be a set up for a major bull run. This is not the topic of this article, but that trend is majorly driven by outflows from Coinbase and thus highly likely by institutional and large investors. This indicates that bitcoins might not flow back to exchanges in bigger amounts any time soon before hitting this cycle’s top. So the patterns might not repeat as in 2016/2017, and bitcoin could hit a new all-time high with the bitcoin balance on exchanges declining.
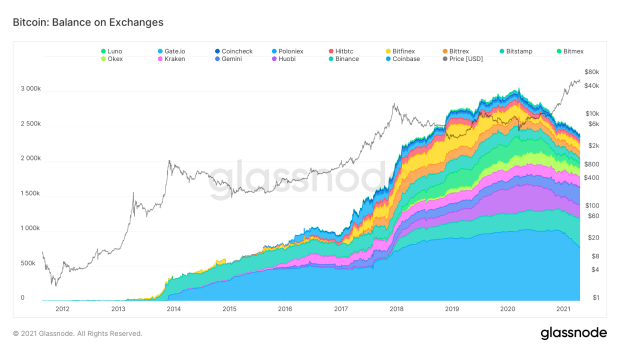
Opposed to Coinbase, for example, Binance has seen strong inflows of bitcoin more recently. This is most likely retail depositing bitcoin on Binance to trade altcoins.
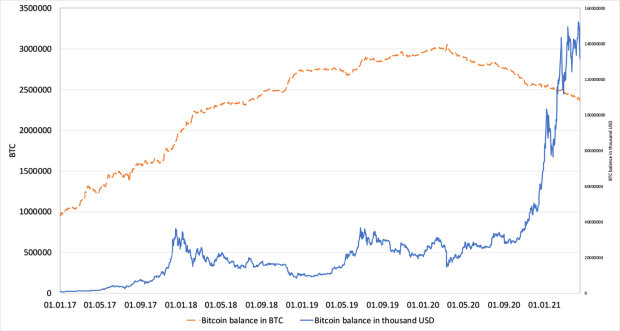
The general bitcoin supply drop on exchanges has led many people in the community (myself included) to talk about a supply shortage or even supply squeeze of bitcoin that will lead bitcoin’s price to inevitably shoot up at some point, when supply dries up. While it is true that bitcoin’s supply is dropping, once you look at the supply held on exchanges in USD terms the picture looks a bit different. In Figure 2, both the bitcoin balance on exchanges and the bitcoin balance on exchanges in terms of USD is shown from 2017 onward. From the first glance at the graph, it appears that, in USD terms, we can’t really talk about a supply shortage, let alone supply squeeze on exchanges. With bitoin’s price taking off in 2020, the supply on exchanges in USD has also been shooting up.
Though the supply increase in USD terms this halving cycle looks impressive, particularly compared to that in 2017, it is also interesting to look at the changes in relative terms. In Table 1, you can see the minimum and maximum exchange balance during halving cycle 1 (November 28, 2012–July 8, 2016), halving cycle 2 (July 9, 2016–May 10, 2020) and the present halving cycle that started on May 11, 2020.
I have calculated how much the supply has increased from the minimum to the maximum 344 days into each halving cycle; as of the time of this writing, we are now 344 days into the third halving (April 19, 2020). You will notice that, in cycle 1, the increase has been quite massive compared to the other ones. As I show in my article, “Halving Cycles and the Bitcoin Price,” cycle 1 has been rather exceptional in terms of price performance, so that number does not seem that relevant as a guide.
The changes in cycle 2 are more relevant, however. In the present cycle (up until the current date, April 19, 2020), the supply in USD went up roughly six times, while in cycle 2, it increased by nearly eight times. This seems to be a substantial gap, as the gap not only is influenced by the bitcoin balance on exchanges but also by the increase in prices. While the drop in bitcoin balances on exchanges is increasing that gap, an increase in bitcoin’s price is narrowing it. In the present cycle, bitcoin is outperforming cycle 2 price-wise. Now 344 days into this cycle, bitcoin’s price increased by nearly 550%, while in cycle 2 it only increased by roughly 307% over the same time span. This means that the gap would have been much bigger with a similar price performance as in cycle 2.

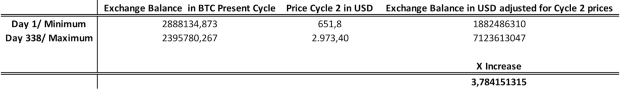
To account for that, I have calculated the exchange balance gap for this cycle by adjusting for cycle 2 prices in Table 2. The minimum balance in USD terms on exchanges coincides with day one of this halving cycle. At that time, there were roughly 2,888,135 bitcoin on spot exchanges. This amount of bitcoin is then multiplied by the price of bitcoin at day one during cycle 2. This gives us an idea of how much the minimum balance on exchanges would have been in terms of USD at cycle 2 prices. I have done the same for the maximum balance on exchanges. The maximum balance on exchanges in terms of USD this cycle has been on day 338 with roughly 2,395,780 bitcoin, which is substantially lower than on day one. I have now multiplied this amount of bitcoin with the price of bitcoin 338 days into cycle 2. With that, I have minimum and maximum numbers that are adjusted for cycle 2’s prices. These allow me to calculate a hypothetical supply change and to calculate the supply gap between both cycles. Adjusted for cycle 2’s prices, the supply on exchanges in USD terms has only increased roughly 3.8 times versus 6.1 times without adjustments. This is a large difference. Compared to the nearly eight times increase in cycle 2 from Table 1, we can really begin to speak about a bitcoin exchange balance supply shortage here.
While other factors at play could explain the difference in price performance of the two cycles, the drop in bitcoin supply on spot exchanges is majorly driven by large-scale investors and Coinbase seems to play a key factor.
To conclude, purely looking at the bitcoin balance on exchanges, we can observe a clear trend in this cycle where the supply keeps falling. On the other hand, looking at bitcoin’s supply in USD terms, the trend is upward, driven by bitcoin’s price performance. This price performance is, of course, not externally driven and influenced by the supply on exchanges. As I have shown, the gap in USD terms is already substantial without adjusting for prices and, after adjusting for cycle 2 prices, the supply gap in USD terms becomes very large (an increase of nearly eight times in cycle 2 versus an increase of less than four times this cycle). So, once we look at relative terms between the present cycle and cycle 2, there also seems to be a supply shortage in USD terms and not only in terms of bitcoin. Following this, the bitcoin balance on exchanges is an essential metric during this cycle, which warrants a closer look to see where bitcoin is headed next and, as explained earlier, could be a potential setup for a major bull run.
This is a guest post by Jan Wuestenfeld. Opinions expressed are entirely their own and do not necessarily reflect those of BTC, Inc. or Bitcoin Magazine.
Leave a Reply