The past 24 hours have been characterized by fear, uncertainty, and doubt in the cryptocurrency market. The state of commotion among investors and market participants alike appears to have been triggered by a 50 BTC transaction originating from a wallet that had not been touched in over a decade.
As speculation mounted that the transaction was made by Satoshi Nakamoto, many believed that Bitcoin’s creator was preparing to dump his holdings. Although data reveals that this is not the case and the wallet could simply belong to an early miner, the damage is already done.
Since the news broke, the flagship cryptocurrency has plummeted by more than 10 percent and it recently dipped below $9,000. On its way down, Bitcoin has liquidated over $70 million worth of long and short positions on crypto derivatives exchange BitMEX, according to data from Datamish.
Bitcoin sits at a critical point
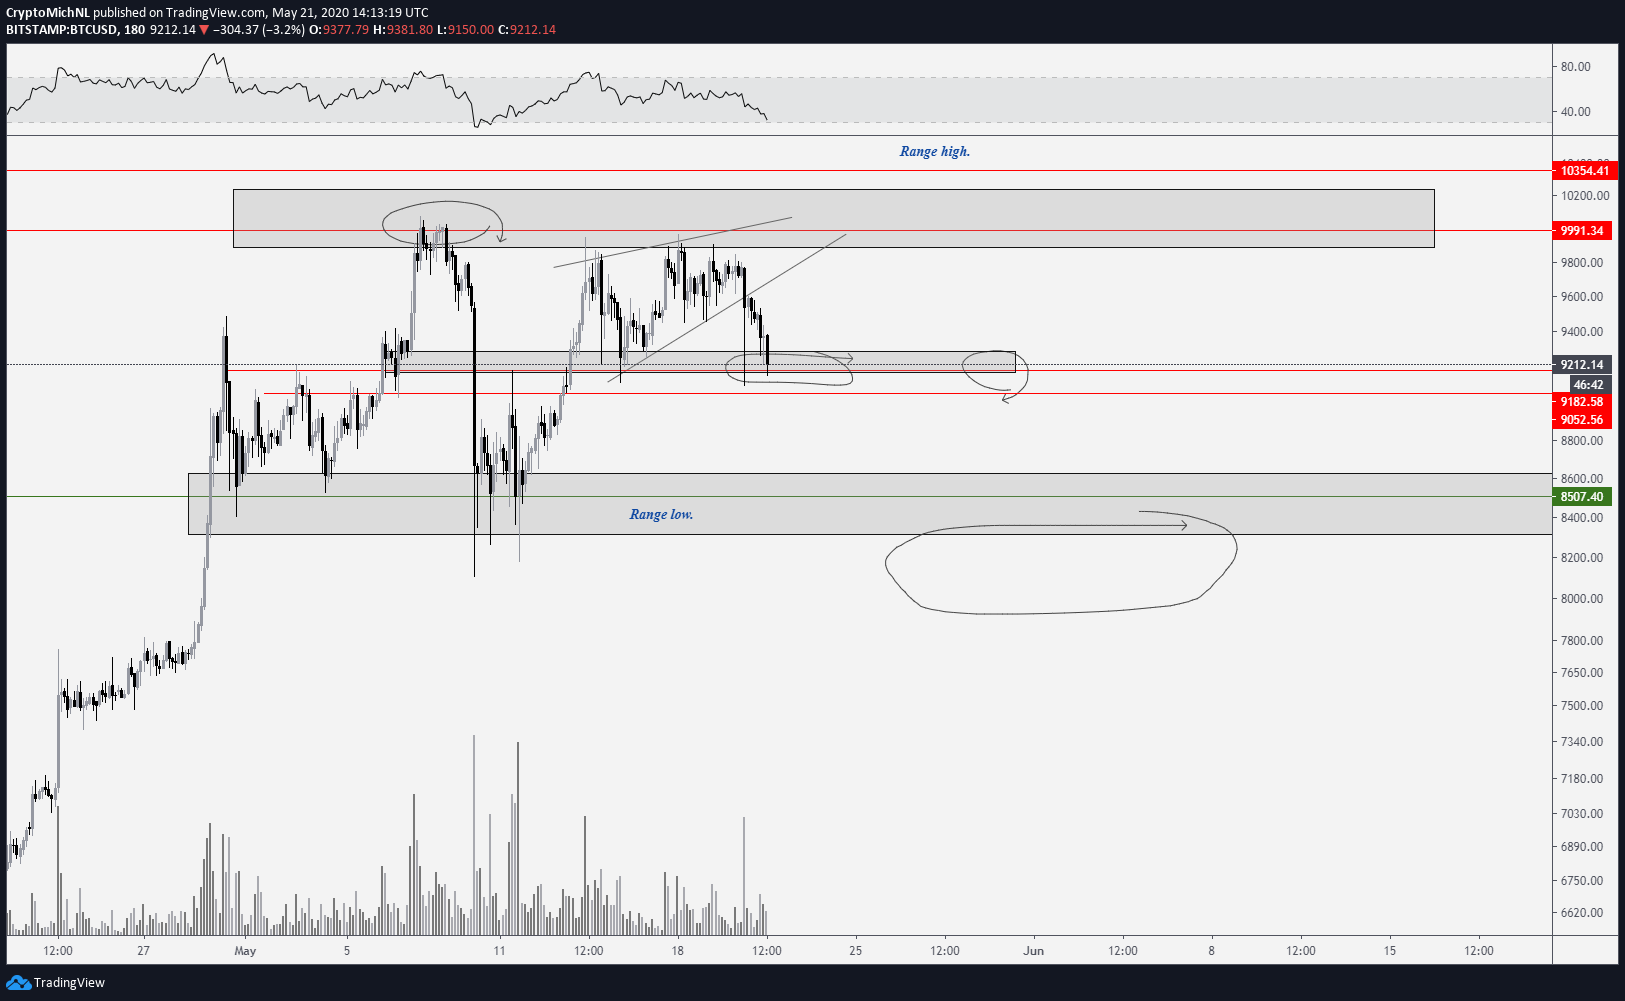
From a technical perspective, Michael van de Poppe, a full-time trader based in Amsterdam, said that the $9,000 support level plays an important role in Bitcoin’s uptrend.
The analyst maintains that if the bellwether cryptocurrency is able to hold above this major supply barrier, it could easily bounce back and retest the $10,000 resistance level. But if the selling pressure behind Bitcoin increases, this level of support could break and jeopardize the bullish outlook.
Under such circumstances, van de Poppe believes that the bearish momentum could have the ability to push BTC’s price towards $8,500 or even $8,200.

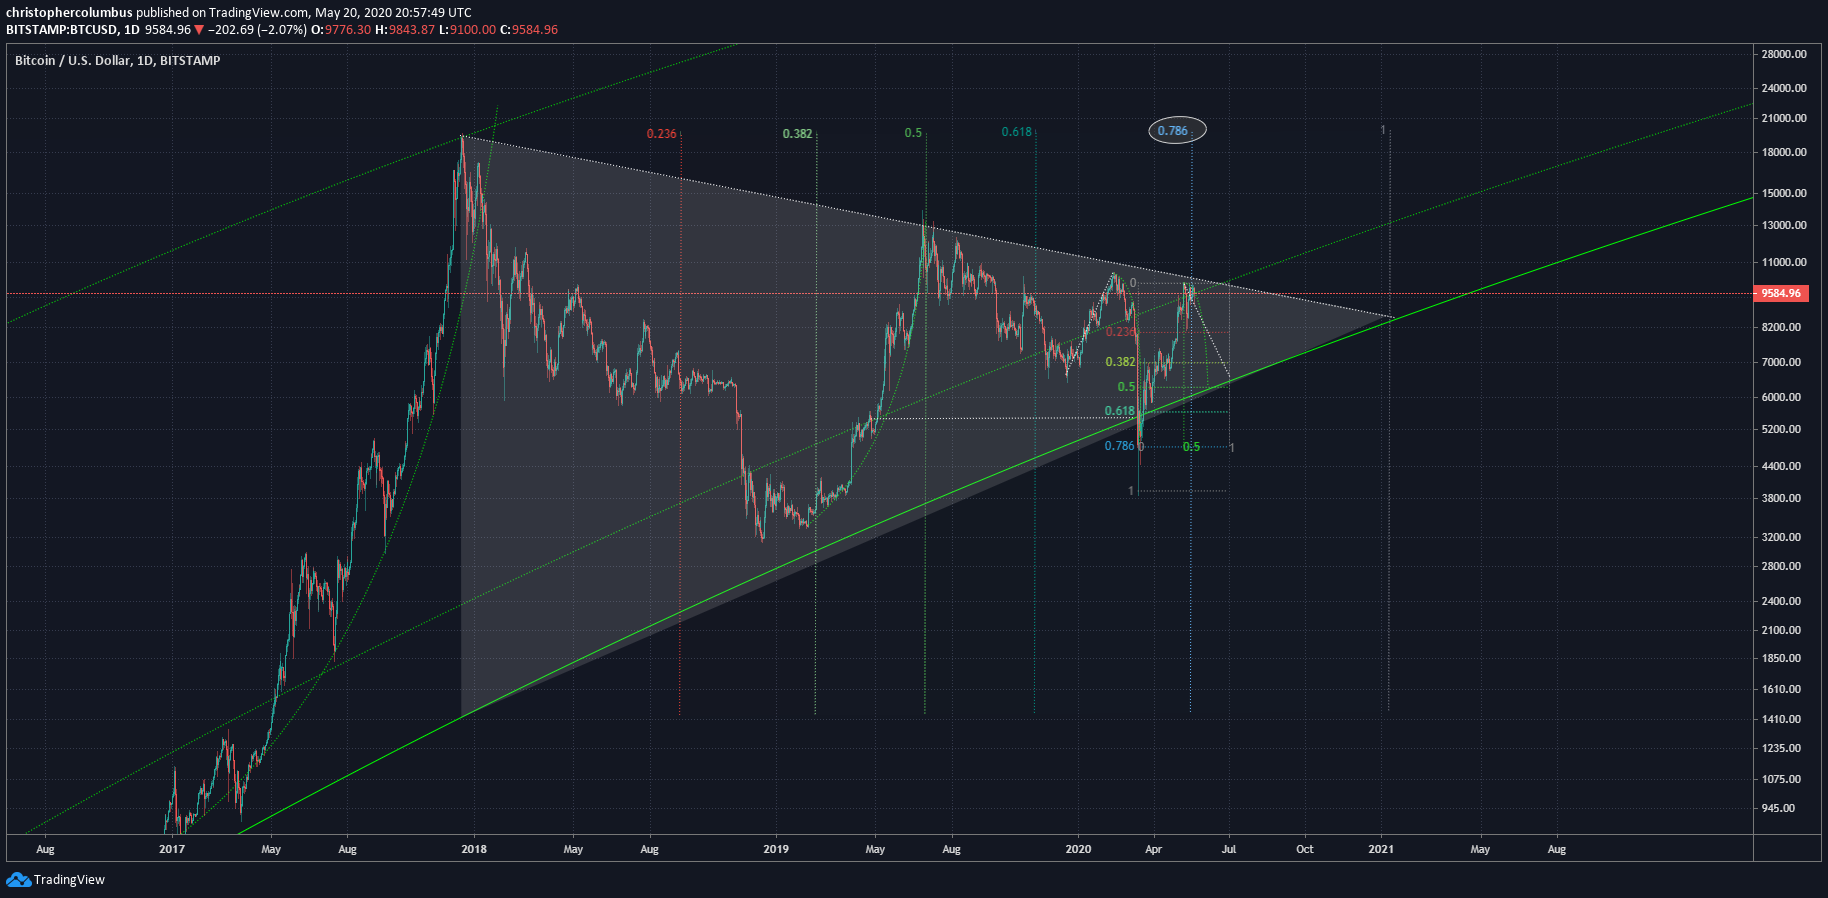
Meanwhile, trading aficionado, Dave the Wave, has repeatedly stated that Bitcoin is bound for a more significant correction. The well-known chartist has pointed out over the past couple of weeks that the pioneer cryptocurrency was sitting at overbought territory.
Due to the significance of the upper pressure that Bitcoin experienced since March’s Black Thursday, Dave argues that an increase in sell orders could trigger a retracement to $6,000.

Investors are in the red
Out of all Bitcoin addresses, more than 49% are currently “In the Money,” while 50.7% are “Out of the Money,” according to IntoTheBlock’s “In/Out of the Money Around Price” model.
These figures may indicate that after the recent downward movement, BTC holders could be losing confidence about what the near-term future holds.

In the event of a steeper, the Global In/Out of the Money model shows that Dave’s $6,000 target may come true since there is barely any significant support barrier in-between.
At around $6,300, roughly 3.7 million addresses bought more than 2 million BTC. This massive supply wall might help prevent any further selling pressure.

Although a $6,000 Bitcoin after the recent halving may seem out of the question, such a massive bearish impulse could help wipe out some of the so-called “weak hands” while allowing sidelined investors to get back into the market.
A new inflow of fresh capital into the industry could eventually propel Bitcoin to higher highs and enter the bull market that most investors and crypto enthusiasts alike have been expecting.
The post On-chain metrics spell trouble as Bitcoin dips below $9,000 appeared first on CryptoSlate.
Leave a Reply